Let's monitor our API 🔎
Oct 19, 2024
In the last 3 weeks we have
-
Built a production-ready REST API to serve taxi trip data 🚕,
-
Dockerized it with a few tricks 📦, and
-
Deployed it to a production Kubernetes cluster using Gimlet 🚀.
Let’s go one step further.
Let me show you how to monitor our API in real-time, using open-source tools.
Let’s go!
You can find all the source code in this repository
Give it a star ⭐ on Github to support my work
Why monitoring? 🔎
Our API is working, meaning, it serves the data we promised our customers.
However, there are things we don’t have visibility, for example the response time.
What is the response time? ⏳
The response time is the time elapsed between sending a request to an API and receiving the response. It's usually measured in milliseconds (ms)
A higher response time means our end users need to wait longer to get the data they want. And this leads to users frustration and can ultimately lead to churn 😵💫
So the question is
How can you ensure your API delivers the correct data fast enough ⚡?
Let me show you how with an example ↓↓↓
Hands-on example 👨💻
Let’s take the API we built and deployed last week, and add a basic monitoring system to track its response time.
You can find all the source code in this Github repository.
Give it a star ⭐ on Github to support my work
These are the steps:
Step 1. Spin up Elasticsearch and Kibana 🏗
-
Elasticsearch is a very popular database to store logs and app metrics, and
-
Kibana is a dashboarding tool on top of Elastic Search you can use to visualize the data.
For development purposes you can use a docker-compose like this, to spin up a minimal elasticsearch + kibana stack
name: elastic_search_and_kibana

services:
  elasticsearch:
    image: docker.elastic.co/elasticsearch/elasticsearch:7.14.0
    container_name: elasticsearch
    environment:
      - discovery.type=single-node
      - ES_JAVA_OPTS=-Xms512m -Xmx512m
    ports:
      - "9200:9200"
      - "9300:9300"
    volumes:
      - elasticsearch_data:/usr/share/elasticsearch/data
    networks:
      - elasticsearch

  kibana:
    image: docker.elastic.co/kibana/kibana:7.14.0
    container_name: kibana
    ports:
      - "5601:5601"
    environment:
      - ELASTICSEARCH_HOSTS=http://elasticsearch:9200
    depends_on:
      - elasticsearch
    volumes:
      - kibana_data:/usr/share/kibana/data
    networks:
      - elasticsearch

networks:
  elasticsearch:
    driver: bridge
    name: elasticsearch

volumes:
  elasticsearch_data:
  kibana_data:
From the root of the project, run
$ make start-infrato spin these 2 services locally.
Step 2. Add a FastAPI middleware ᯓ★
The easiest way to start tracking response time in your FastAPI is to use a middleware component, like this, that
-
computes the response time for each requests, and
-
saves this event in our Elasticsearch server
import time
from datetime import datetime

from elasticsearch import Elasticsearch
from fastapi import Request
from starlette.middleware.base import BaseHTTPMiddleware

from src.config import elasticsearch_config

# Initialize Elasticsearch client
es = Elasticsearch([elasticsearch_config.host])

class TimingMiddleware(BaseHTTPMiddleware):

    async def dispatch(self, request: Request, call_next):
        if request.url.path == "/trips":
            start_time = time.time()
            response = await call_next(request)
            process_time = time.time() - start_time

            # Log to Elasticsearch
            es.index(
                index=elasticsearch_config.index,
                body={
                    "endpoint": "/trips",
                    "method": request.method,
                    "process_time": process_time,
                    "timestamp": datetime.utcnow().isoformat()
                }
            )

            return response
        return await call_next(request)
To save data to Elasticsearch from our Python script we need at least 2 parameters:
-
elasticsearch_config.host→ e.g. http://localhost:9200 in this dev environment. -
elasticsearch_config.index → e.g.“taxi_data_api” which is the name of the index (aka table) inside Elasticsearch where we save these events.
Step 3. Create a Kibana dashboard 🎛️
-
Head to localhost:560 and
-
Go to Management > Stack Management and Connect Kibana to the Elasticsearch index where we are saving our events, which is “taxi_data_api” in this case.
From there, go to Dashboard > Create New dashboard so you can start creating a dashboard with easy drag and drop
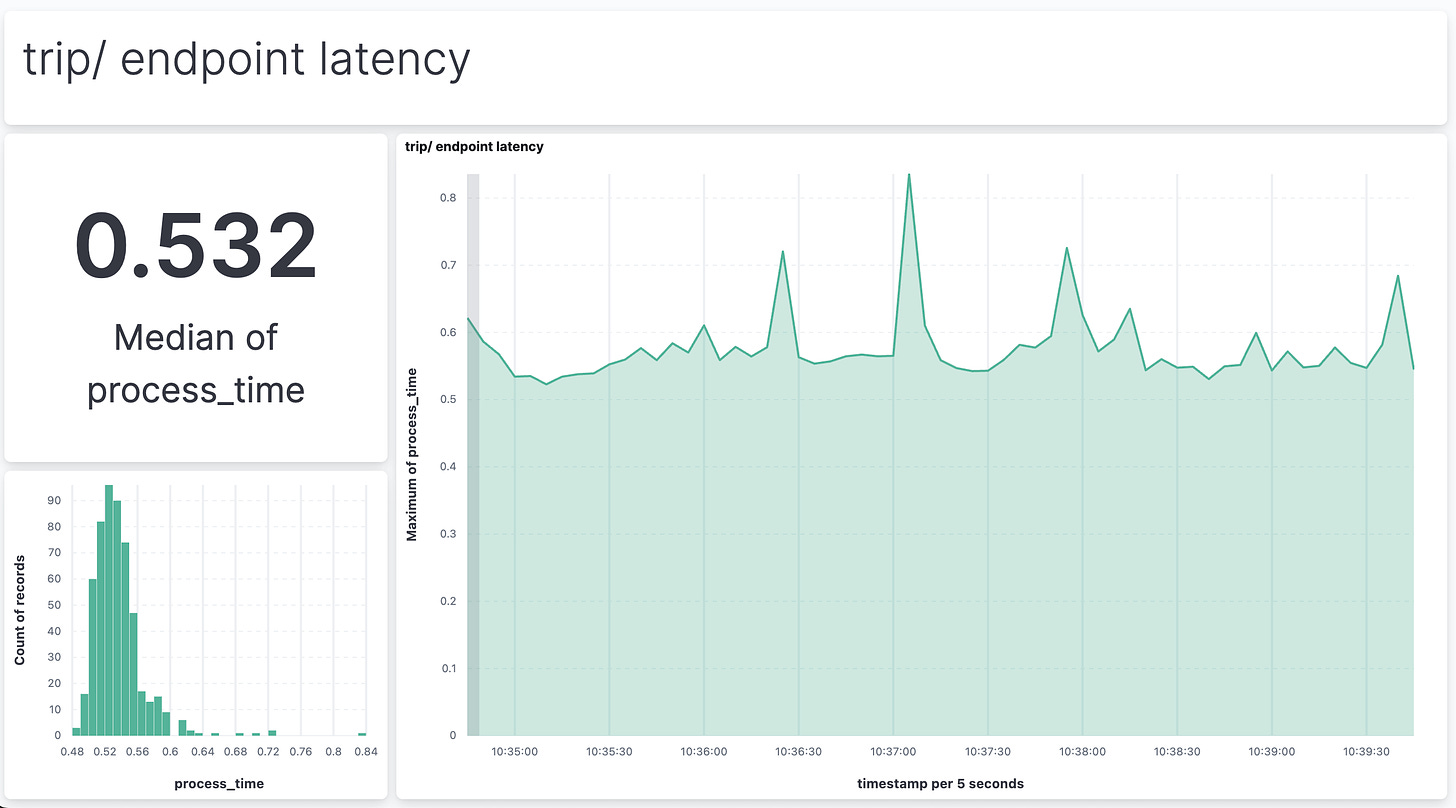
For example, this is what mine looks like.

Step 4. Test things work 🧪
Let’s see the system in action.
-
Spin up the API locally with
$ make run -
Send 10,000 requests to the API with
$ make many-requests-local N=10000 -
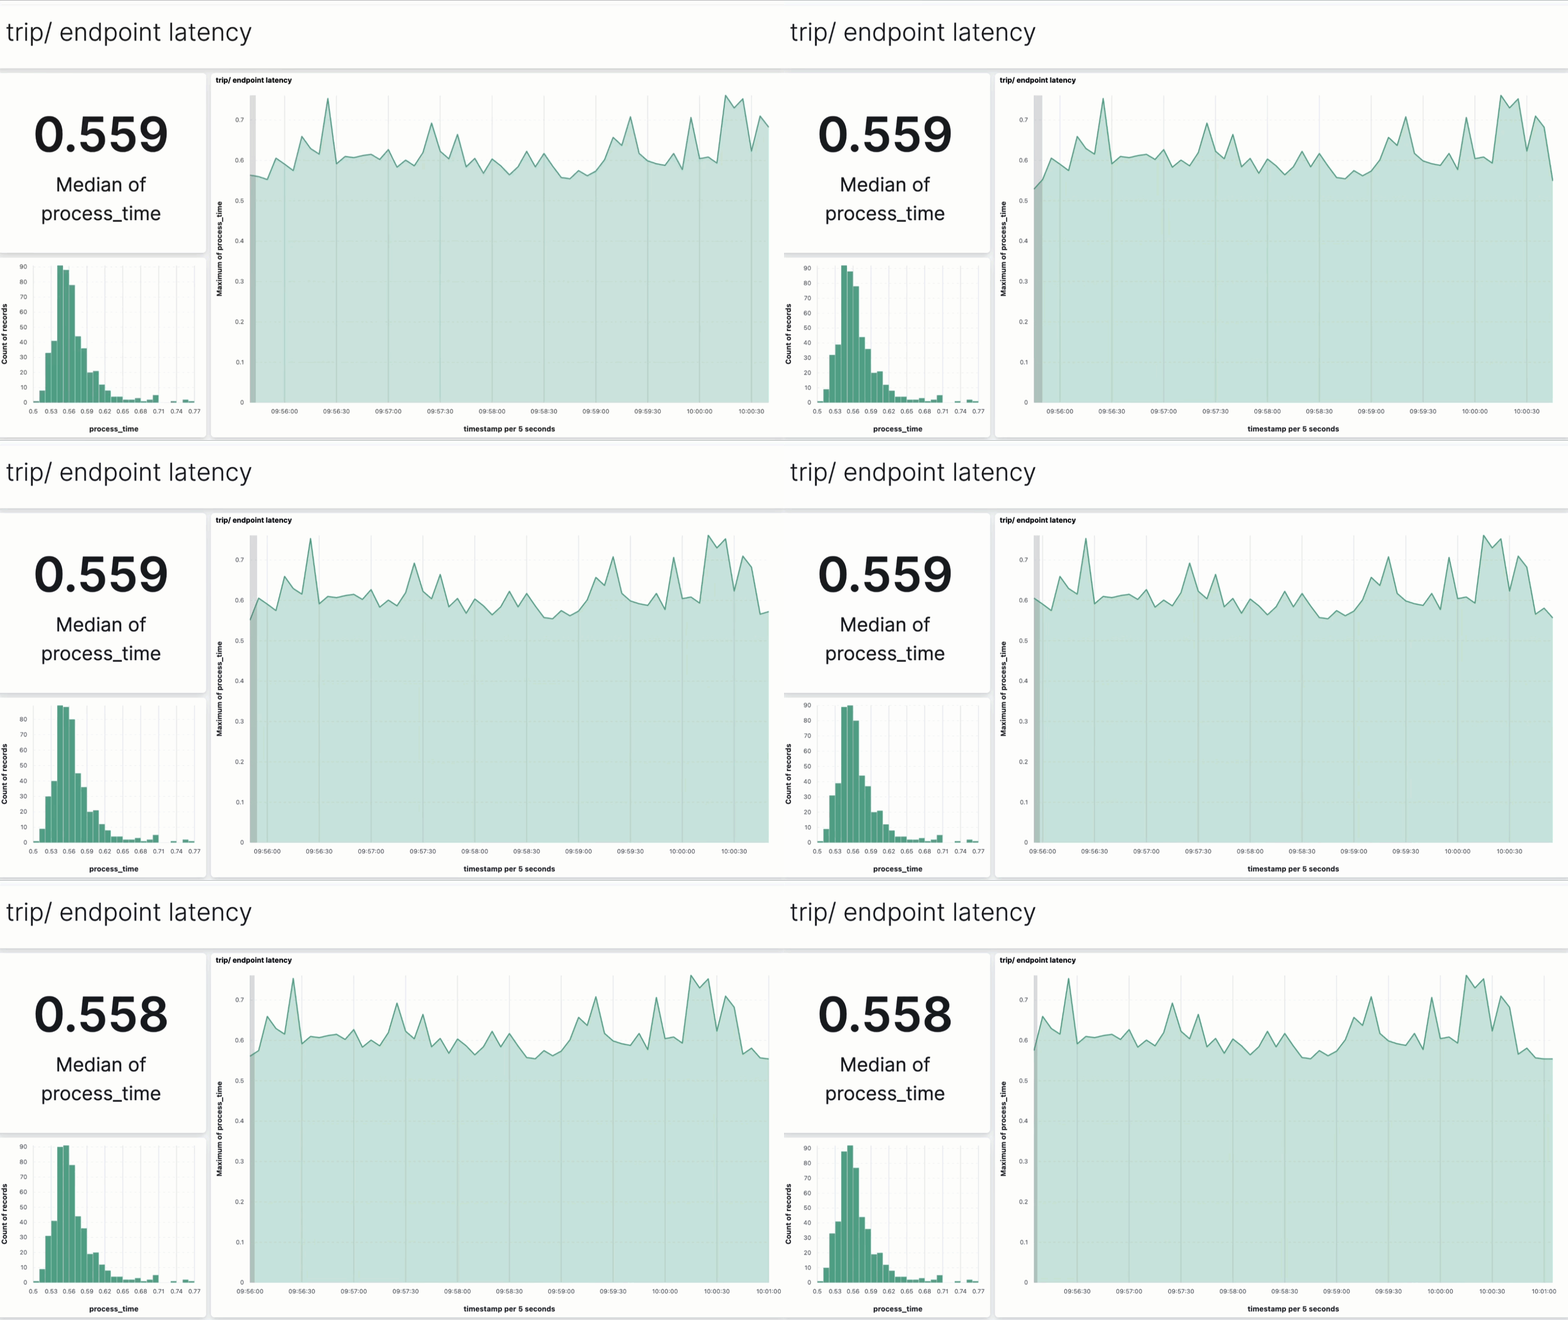
And head to the dashboard to see the data flowing 🔀
BOOM! 🔥
Wanna build a real-time ML system with us? 👨👨👦👦
In December 2nd, 200+ brave students and myself will start AGAIN a 4-week journey to build a real-time ML system.
-
From scratch
-
Using open-source tools, and
-
Following MLOps best-practices.
This time we will build a real-time ML system to predict taxi arrivals, which is exactly what Uber does every time you order a ride 🚕

Gift 🎁
Join today with a 40% early bird discount and
✔️ Access every future cohort forever. No need to pay again.
✔️ 60+ hours of recorded sessions from the previous 2 cohorts
✔️ Full source code of a crypto price predictor system.

Talk to you next week,
Enjoy the weekend
Pau

